Features
See the sample, not just the number
Every scan comes with its graphs: the length distribution by weight with the whole-grain length marked, length against width for every grain, and a grading sharpness score that shows how evenly the lot was graded.
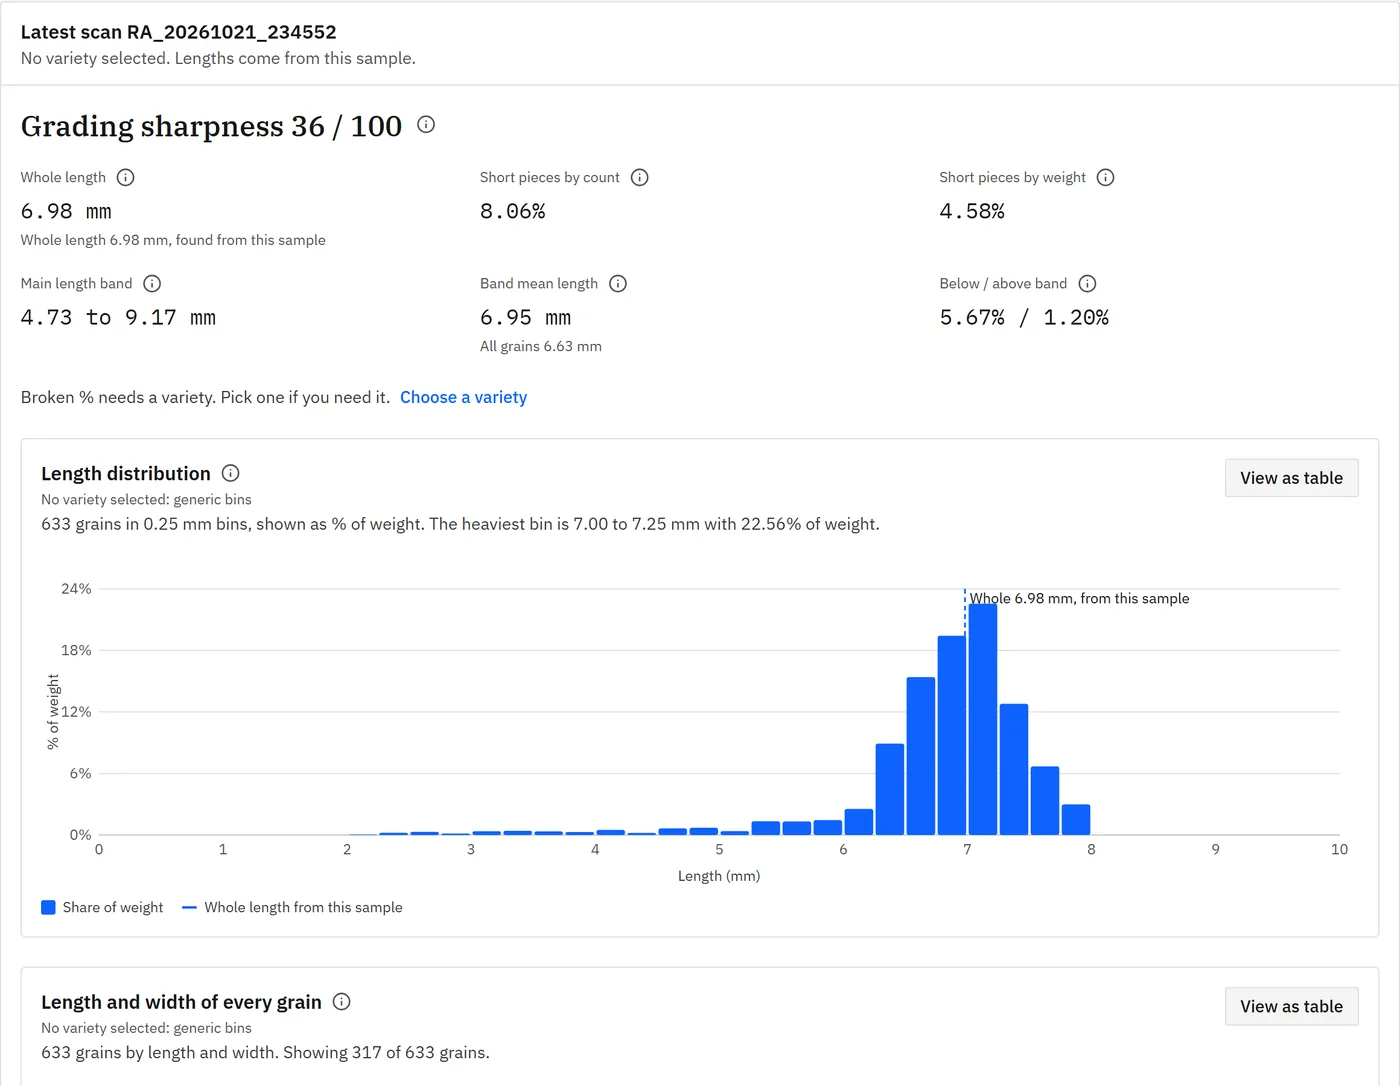
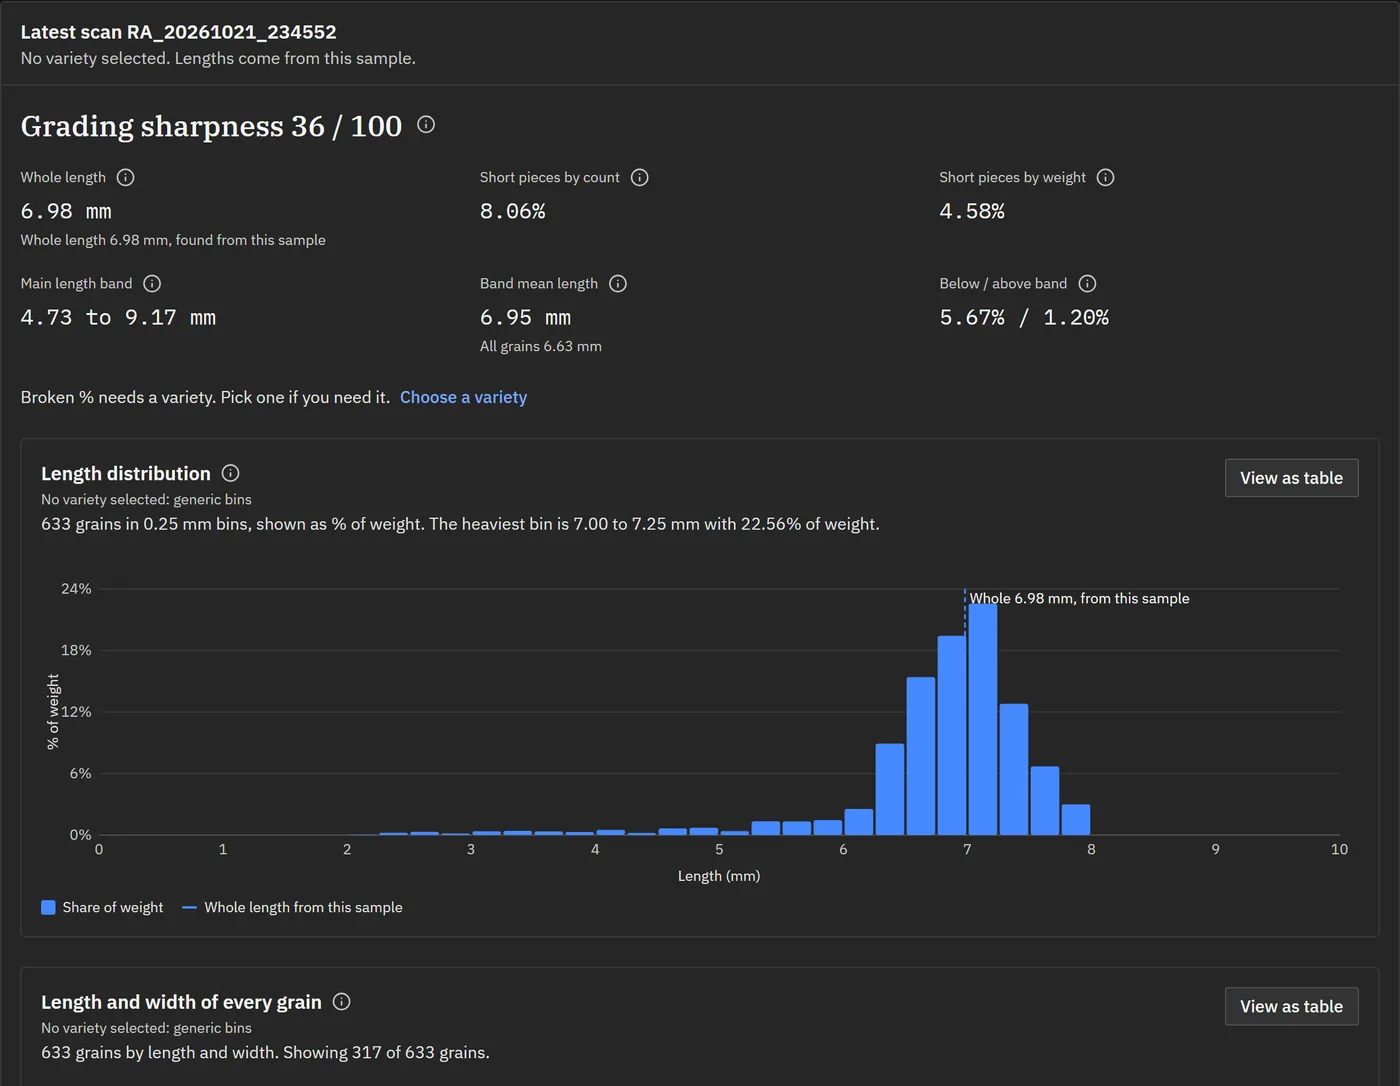
- Grading sharpness
- A score out of 100. Higher means the lot was graded to a tighter length band.
- Length distribution
- Share of weight in each 0.25 mm bin, with the whole length found for this sample.
- Length by width
- Every grain plotted, so mixed lots and broken pieces stand out.
- Every figure explained
- Each graph and headline number has an info button that says how it is measured.